Data-driven Approach for Growing SMBs
When building a small or medium business it’s easy to get side tracked into work that seems important and impactful, but often there is no clear indication that it actually is. It's easy to go down the path where the team is either reacting to external requests or filling up their work queue with tasks whose long term value is not clear. The work gets done, the progress is made, but what is the actual value created with the effort put in? It’s important to know that you’re focusing your efforts on the initiatives which create the most value. Being data-driven is a way to have better clarity and be more mindful about work. Data-driven means using data to inform decision-making, problem-solving, and strategy development.
Quite often businesses start by throwing ideas and seeing what sticks. After a business idea has been identified and successfully validated, the company starts to grow and the approach that worked so far is no longer the best way to approach growth. There are too many unknowns about the business that a single person can't reason about and make the right decisions. Adding people to focus on smaller domains helps, but there needs to be a clear indication that distributed initiatives are creating value and improving business as a whole. One of our clients had such a challenge, where they were receiving too many external requests about their product and most of their time was spent being reactive in supporting them. They didn’t really have a bigger picture of how business is performing. When we were brought on the project our main request was to help them grow the platform, but our main goal was to help them better understand their business and how they can grow it by being data-driven.
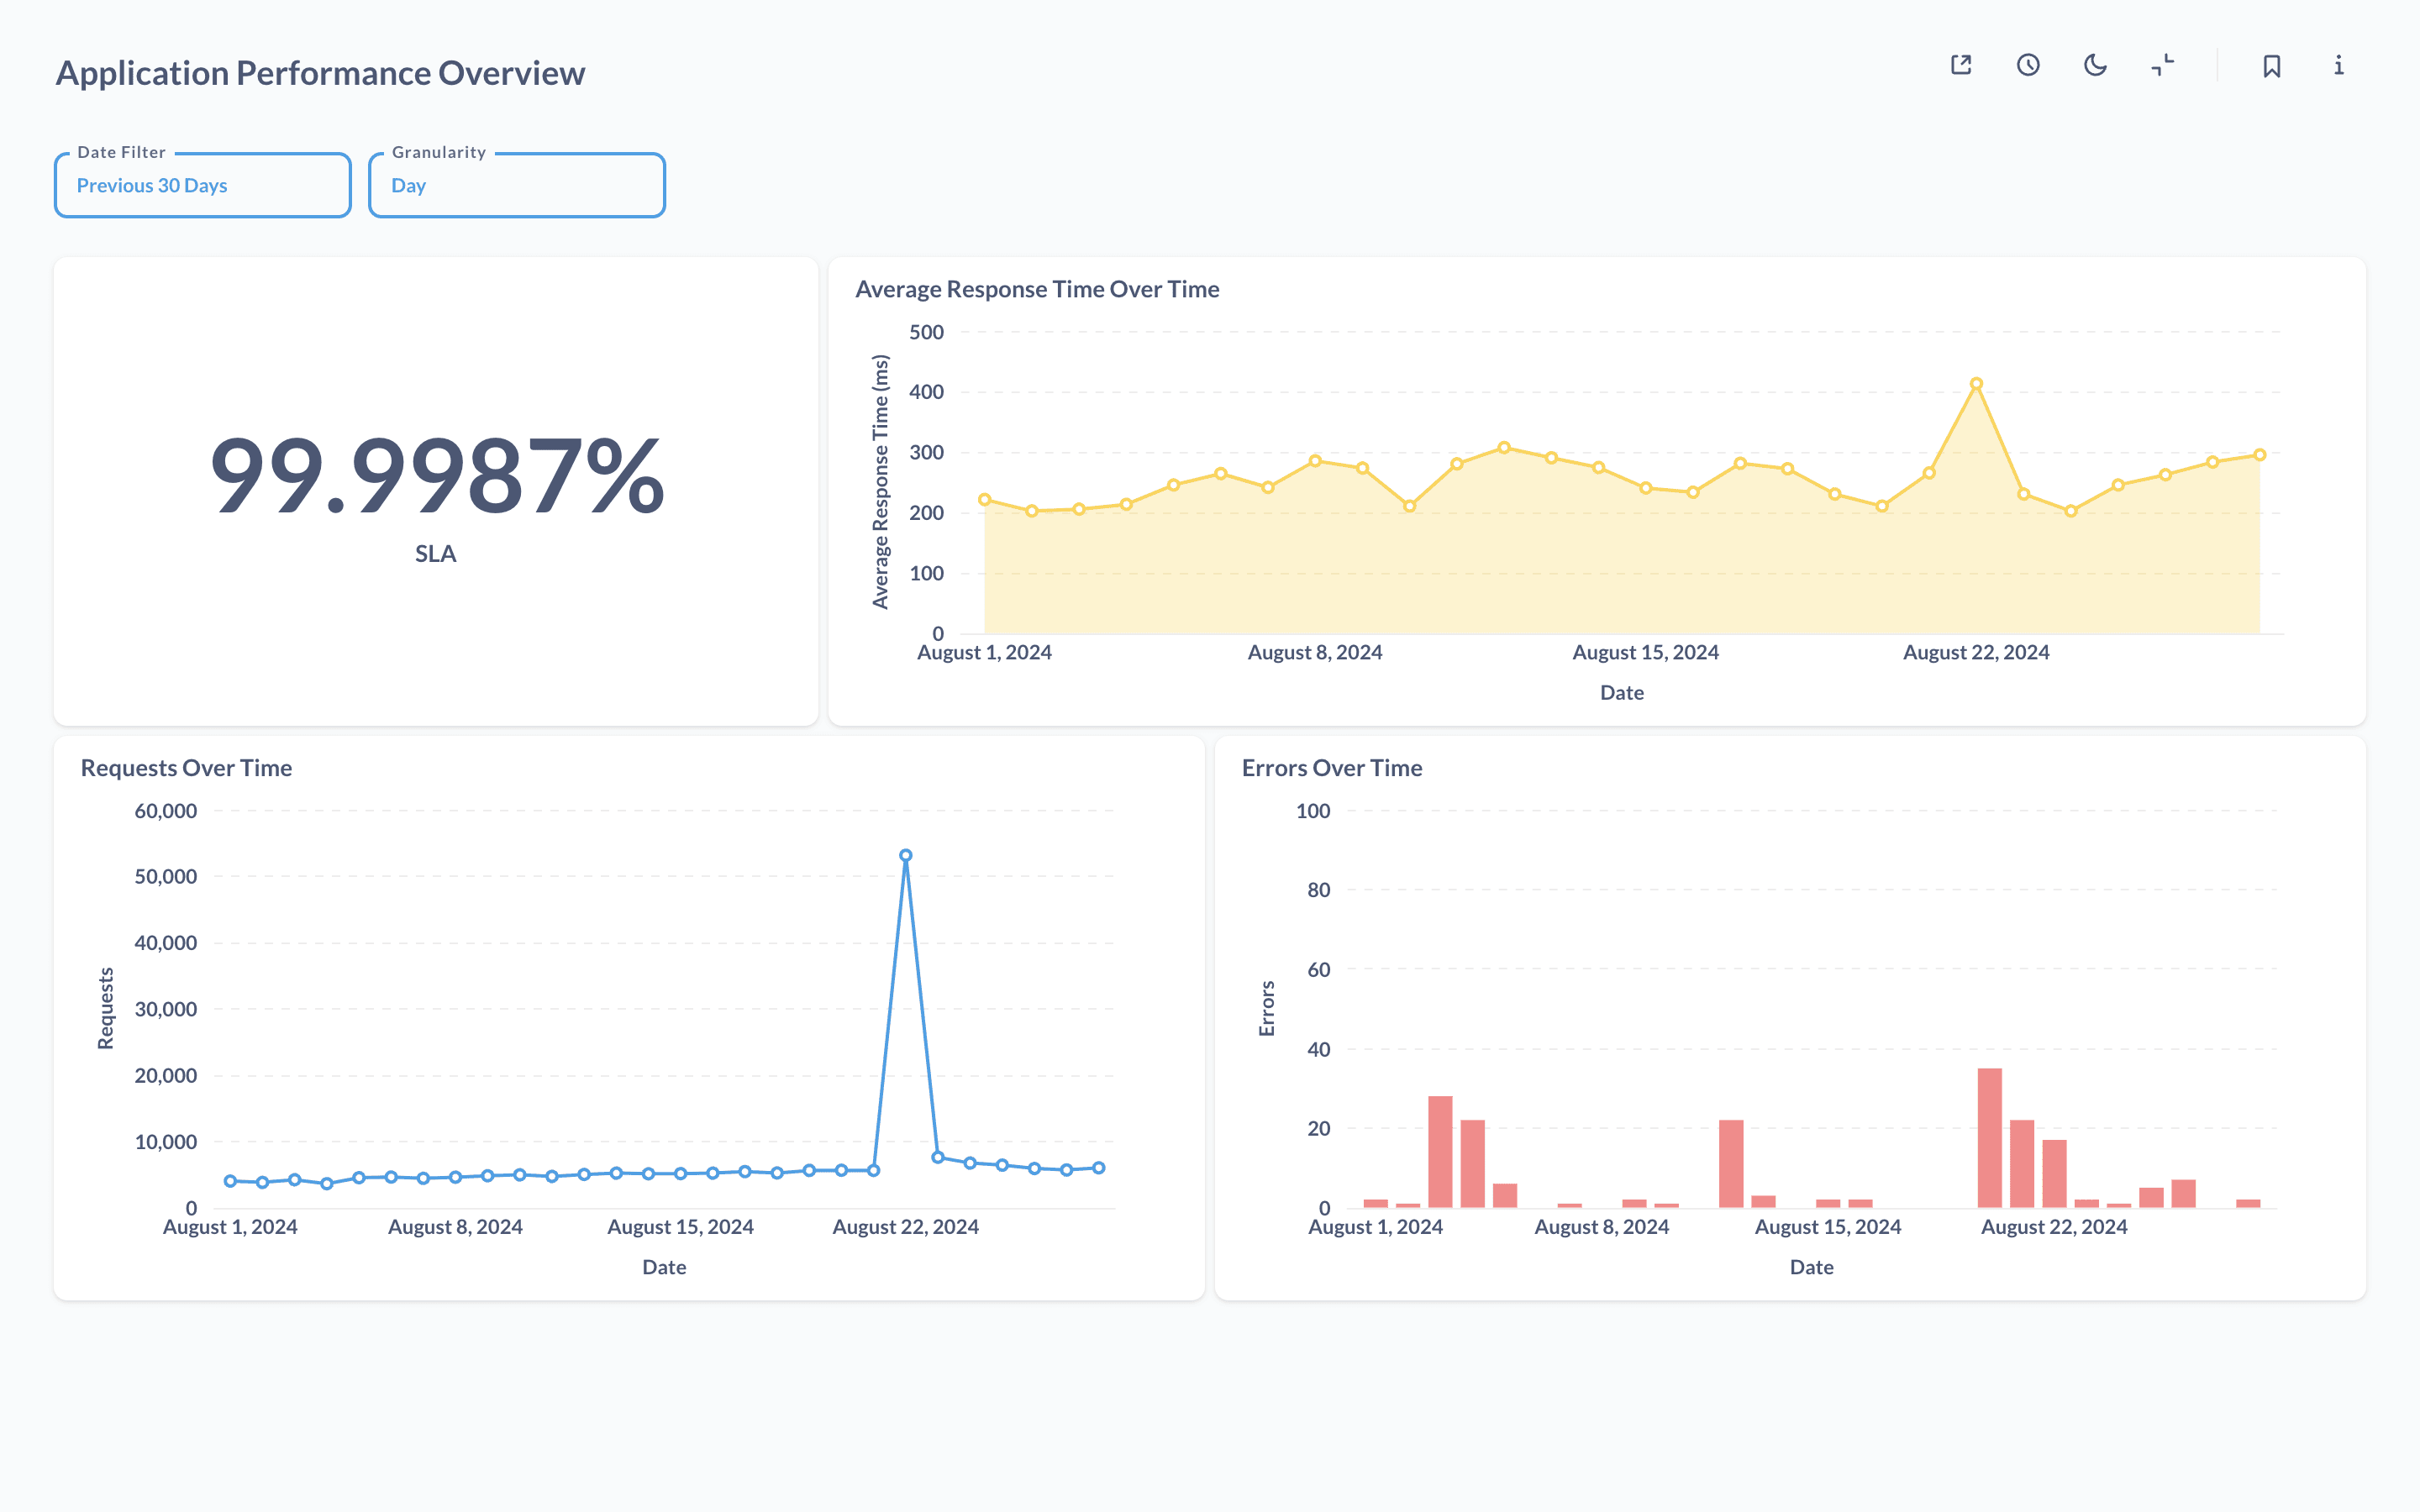
The objective was to reduce clutter created by external requests. This essentially meant to improve stability and performance of the platform, since that was the main source of the requests. To start, it was important to identify which metrics best describe the progress that we will be making towards the objective. Different businesses and challenges have different sets of metrics that should be tracked. For example a B2C product company usually needs to track how their users are using their platforms: how many unique visits they are getting, how often their users are returning to the platform and how long their sessions last... A useful tool for identifying and tracking metrics are Objectives and Key Results(OKRs). Company leadership can define Objectives that they would like to achieve and Key Results that track progress towards achieving those objectives. Key Results are trackable and we can connect them with our data and share it with the team, while making sure that our data is accurate, up to date and accessible. For our case, the objective was clear: Improve stability and performance of the platform. Key results in our case were SLA of 99.99%, keeping bug reports below a certain threshold, increasing requests processed per minute and being able to handle 1000x peaks in traffic.
To start with implementing a data-driven approach, a simple spreadsheet can be used to store the data and visualize the metrics. As the data volume grows, we can incorporate more complex solutions like data warehouse solutions for data storage. For our case, the data set we needed to process was already large since we were collecting user usage events, infrastructure events, bug ticket logs and business metrics. Luckily for us, most of what we needed was easily collectable from tools and infrastructure we were using. We decided to go with a data warehouse and stored everything in Redshift.
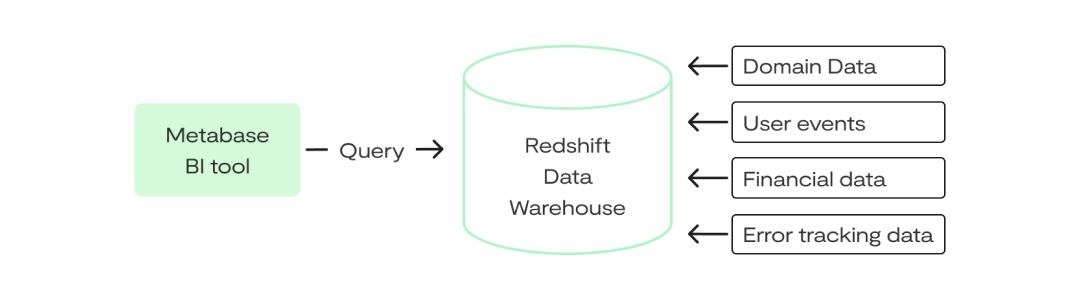
If starting simple, data can be visualized in spreadsheets. We wanted to have a more robust data visualization from the start, so we decided to use Metabase. It allows us to build robust dashboards and has user access control. Having user control enabled us to share the dashboards with the whole company at the appropriate access level. Sharing dashboards with everyone in the company is a great way to keep everyone involved in company success. That way everyone can bring their unique perspective and provide ideas on how to improve the company's weak points. The initial dashboards we built were visualizing metrics like amount of requests served, response times, errors etc…. Those dashboards were a great way to show progress we were making and they became part of our company check-ins. This increased transparency for the whole company and everyone could track how the whole product was becoming much more robust. As we were improving the performance and stability we formed a collaboration with sales and customer success where they were collaborating with us about upcoming peaks of traffic. We used those to make sure everything runs smoothly and to identify weak points of the system so we could improve them. It was a great collaboration with multiple parts of the company. Eventually we built dashboards that were tracking business processes as well. As a result our user base grew as everyone was becoming more confident in the product. Our graphs even became a part of pitch decks and helped raise the next round of funding.
Being data-driven is something we try to help all our clients with. Although we can’t predict the future with it, it can help us identify the weak points and track the impact of work we’re doing to fix them. It’s a great approach to better understanding how business is evolving and includes the whole team in it.
References
You might also like reading these blog posts:
Error Handling in Scala: Navigating Try, Either, and ZIO
Dimitrije Bulaja
Stop Chasing Ideas Start Validating Products
Filip Komnenović